See where the class gets stuck before the next lesson begins.

Grade Assessment Analytics shows you how the whole class answered every quiz question, inside the Grade Assessment screens you already use.

New Quiz and legacy SCORM Admin, Institute and Teacher logins
KITABOO Studio Grade Assessment dashboard showing Class Metrics
Grade Assessment dashboard, one class and one activity selected
50% chose the same wrong option

A score tells you what happened. A pattern tells you what to do next.

Rows rank students. They do not say which question lost the class, or which wrong answer the class agreed on. That signal is already in your data.

Twenty-five separate rows One question, 25 responses

The same responses, ordered by the option each student chose. Nothing new was collected.

Four screens, from who finished to what to reteach.

Dashboard

See who finished before you read the scores.

Pick a class and an activity. Completion appears straight away, and the student table sorts by score, status or time taken.

Review & Grade

Open one student without losing the class.

Class Correct Answer Percentage sits beside every supported MCQ. Switch students from the dropdown without returning to the dashboard.

Question Analytics

See the answer the class believed.

Every option shows how many students chose it, with the correct answer set apart from the wrong answer that drew the most.

All Class Answer Percentage

Turn the assessment into something you can send.

Overall performance, participation and every question's distribution in one view. Export Report produces the lot as HTML in one click.

20 questions 25/25 participated 62% correct 38% incorrect
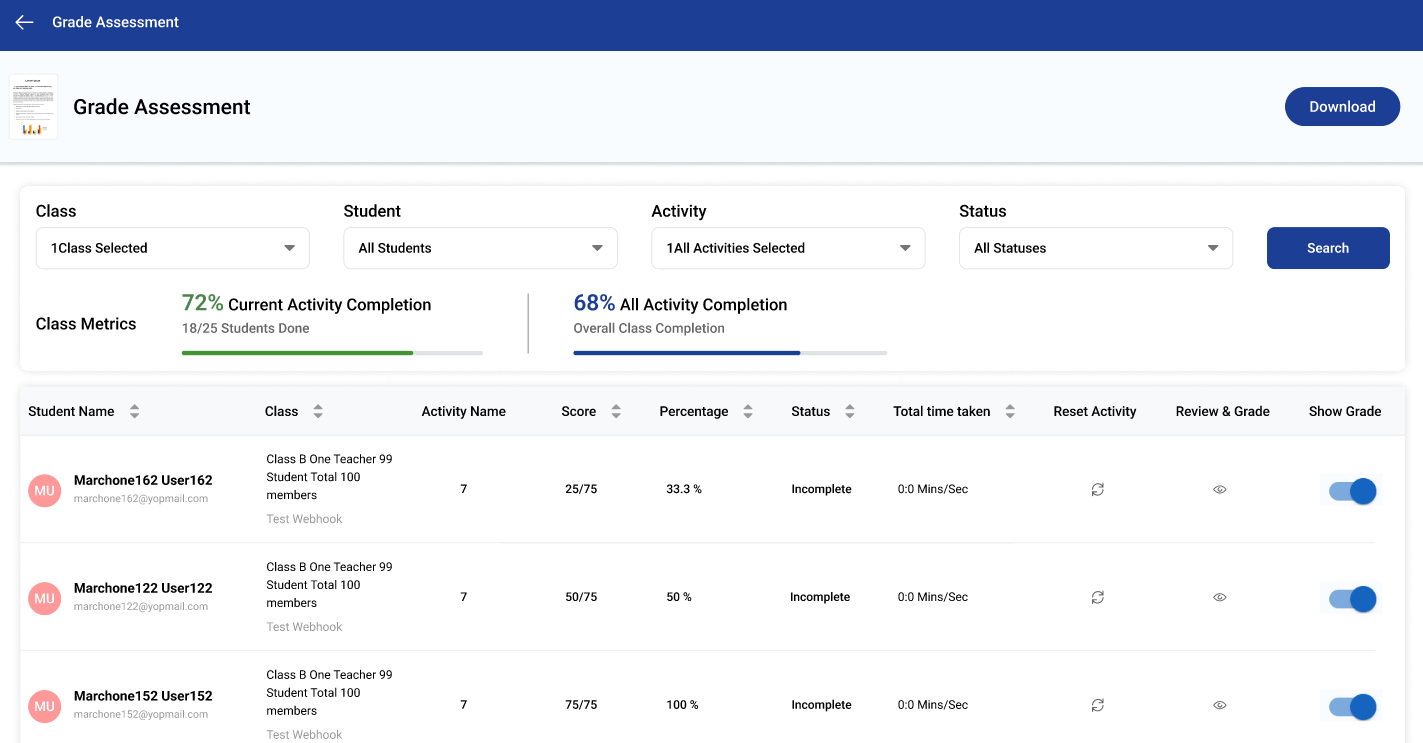
Grade Assessment dashboard
Review and Grade question table
Question Analytics popup
All Class Answer Percentage screen
Class Metrics on the Grade Assessment dashboard

The most useful answer is often the wrong one.

A wrong answer half the class agreed on is one misconception you can teach. Twenty-three wrong answers with no pattern are twenty-three problems you cannot get to before Monday.

What is the basic unit of life?

Cell Correct answer 10%
Tissue 30%
Organ Most selected, and wrong 50%
Half the class chose this option. This is the lesson.
Organ System 10%

The same analytics, scoped to the login.

Nobody sees more than their role permits, and nobody has to ask for access.

Teacher

Your assigned classes and students. This is the daily view.

Teacher view
All Class Answer Percentage screen framed to a teacher's scope
Role permissions decide which classes, students and activities appear.

Your assessments stay exactly where they are.

100%
Backward compatible
2
Quiz formats supported
1,000+
Students per class
Full answer-distribution analytics
MCQ Single Select MCQ Multiple Select New Quiz format Legacy SCORM quiz

Activities without a fixed set of options stay available in Grade Assessment. There is simply no distribution to measure.

Before you ask

FAQs

MCQ Single Select and MCQ Multiple Select, represented as type=choice. Fill in the Blank, Match the Pair, Highlighter, Correction, Q&A, Flashcard, Objective and Summary have no fixed option set, so there is no distribution to measure. They stay available in Grade Assessment.

Yes, with the New Quiz format and with legacy SCORM quizzes.

Admin, Institute and Teacher logins, each with role-appropriate data visibility.

Overall correct and incorrect percentages, participation, and the question-level option distribution for every supported MCQ, as HTML. You export it and you decide who receives it.

No. Existing filters, sorting, Review & Grade and Show Grade behaviour stay as they are.

See what your assessments have been trying to tell you.

Bring one of your own classes into a 30-minute call. We will open a real assessment and read one question the way your class answered it.

Question 1, class distribution
Cell, correct 10%
Tissue 30%
Organ, most selected and wrong 50%
Organ System 10%
2/25 correct. 23/25 incorrect. One shared misconception.