Learning Analytics Dashboard – A Detailed Guide
Summarize this blog with your favorite AI:
Imagine having the ability to peer into the intricate web of student progress, engagement, and achievement with unparalleled clarity. Picture a tool that can foresee challenges, tailor learning experiences, and elevate the quality of education for all.
That tool is the Learning Analytics Dashboard, and it’s not just a technological marvel. This tool is a game-changer for anyone involved in the world of teaching and learning.
This blog features everything you need to know about Learning Analytics Dashboard and how it is empowering both learners and instructors.
Table of Contents
I. What is a Learning Analytics Dashboard?
II. Why Must eLearning Platforms Have a Learning Analytics Dashboard?
- Personalized Learning Experiences
- Real-Time Progress Tracking
- Data-Informed Teaching Strategies
- Predictive Analytics for Student Success
- Enhancing Curriculum Development
- Demonstrating ROI and Effectiveness
- Adapting to Changing Needs
- Compliance and Accountability
III. What are the Features of a Learning Analytics Dashboard?
- Data Aggregation
- Visualization
- Key Metrics
- Real-Time or Periodic Updates
- Customization
- Predictive Analytics
- Drill-Down Capability
- Decision Support
- Privacy and Security
- Accessibility to All
IV. Final Thoughts
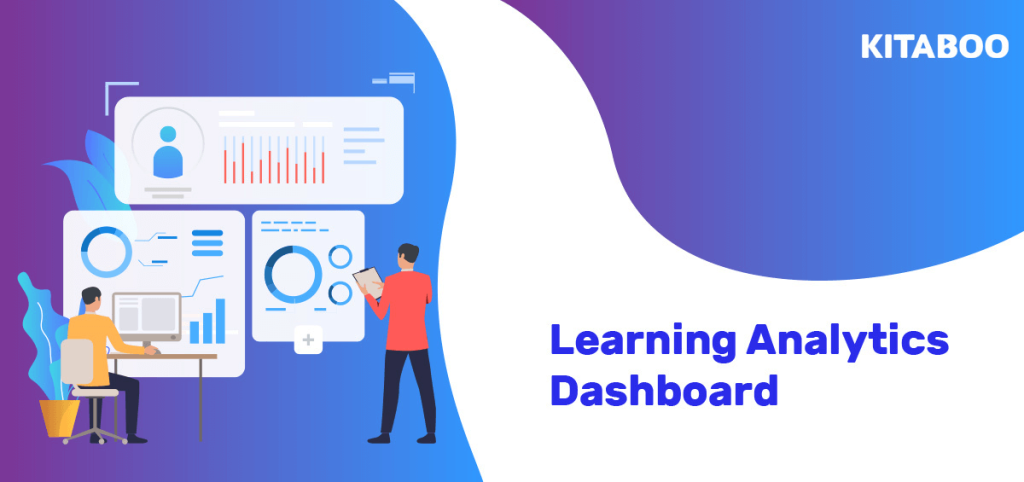
What is a Learning Analytics Dashboard?
A Learning Analytics Dashboard is provided by a digital platform designed to aggregate, visualize, and analyze data related to the learning process.
It acts as a centralized hub that collects data from various sources within the educational ecosystem. This includes Learning Management Systems (LMS), student information systems, online assessments, and other educational technology tools.
This data is then transformed into meaningful visualizations, providing educators, administrators, and students with insights into learning trends, progress, and areas in need of improvement.
Learning Analytics Dashboards like KITABOO‘s also focus on presenting key performance indicators (KPIs) and metrics that matter most in education. These metrics vary depending on the dashboard’s purpose and users’ needs but can include:
- Course Completion Rates
- Assessment Scores
- Attendance Records
- Discussion Forum Participation
Why Must eLearning Platforms Have a Learning Analytics Dashboard?
1. Personalized Learning Experiences
One of the most compelling reasons for eLearning platforms to adopt Learning Analytics Dashboards is their capacity to personalize learning experiences.
These dashboards analyze user data to create individualized learning paths, recommending content, modules, or assessments based on a student’s progress and performance.
This personalization enhances engagement and retention, as learners are more likely to stay motivated when the content is tailored to their needs and abilities.
2. Real-Time Progress Tracking
Learning Analytics Dashboards provide real-time insights into learners’ progress. Students can see their own advancement through a course, which can be incredibly motivating.
Instructors can also use this information to intervene promptly if a student is struggling or falling behind, ensuring that no learner gets left behind in the digital classroom.
3. Data-Informed Teaching Strategies
For educators, Learning Analytics Dashboards like KITABOO’s are invaluable tools for data-informed teaching. KITABOO, the digital textbook platform also offers a window into how students are interacting with the material, where they may be encountering difficulties, and where they excel.
Armed with this information, instructors can adapt their teaching strategies, offer additional support where needed, and refine course content for better outcomes.
4. Predictive Analytics for Student Success
Learning Analytics Dashboards often incorporate predictive analytics capabilities. By analyzing historical data, they can forecast students’ future performance.
For eLearning platforms, this means identifying students who may be at risk of dropping out or struggling with particular topics. Interventions can then be implemented, such as additional tutoring or personalized content recommendations, to increase the likelihood of success.
5. Enhancing Curriculum Development
These dashboards are not just beneficial for learners and instructors; they also aid in curriculum development.
Institutions can use the data generated by Learning Analytics Dashboards to refine course materials and structure. Identifying areas where students frequently struggle can lead to improvements in content delivery and assessment methods.
6. Demonstrating ROI and Effectiveness
For eLearning platform providers, Learning Analytics Dashboards are a valuable asset when it comes to demonstrating the effectiveness and return on investment (ROI) of their offerings.
They can showcase data on student achievement, completion rates, and engagement levels, helping institutions and organizations justify their investment in online education.
7. Adapting to Changing Needs
In the ever-evolving landscape of eLearning, adaptability is key. Learning Analytics Dashboards can adapt to changing educational needs and trends.
As new technologies and teaching methods emerge, these dashboards can evolve to incorporate them, ensuring that eLearning platforms remain relevant and effective.
8. Compliance and Accountability
Institutions and organizations often need to adhere to educational regulations and standards.
Learning Analytics Dashboards can help in ensuring compliance with data privacy regulations and accountability in education. They provide the necessary data and documentation to prove that educational standards are met.
What are the Features of a Learning Analytics Dashboard?
Here are some key features and components of a Learning Analytics Dashboard:
Data Aggregation
Learning Analytics Dashboards collect data from various sources within the educational environment, including learning management systems (LMS), student information systems, online assessments, and other educational technology tools.
Visualization
They use data visualization techniques such as charts, graphs, tables, and other visual representations to make complex educational data more understandable and accessible. Common visualizations include bar charts, line graphs, heatmaps, and scatter plots.
Key Metrics
Dashboards typically display key performance indicators (KPIs) and metrics related to student engagement, progress, achievement, and behavior.
Examples of these metrics include course completion rates, assessment scores, attendance records, and discussion forum participation.
Real-Time or Periodic Updates
Depending on the design, Learning Analytics Dashboards can provide real-time updates or periodic reports to stakeholders. Real-time dashboards allow for immediate intervention, while periodic reports provide insights over time.
Customization
Users can often customize dashboards to focus on specific metrics or aspects of learning that are most relevant to their roles and objectives. Educators might want to monitor student progress, while administrators may be interested in institution-wide trends.
Predictive Analytics
Some advanced dashboards incorporate predictive analytics to forecast future outcomes or identify students at risk of underperforming. Machine learning algorithms may be used to make predictions based on historical data.
Drill-Down Capability
Users can often drill down into specific data points to get more detailed information about individual students, courses, or specific time periods. This helps in pinpointing areas that require attention or improvement.
Decision Support
Learning Analytics Dashboards aim to support decision-making in education by providing actionable insights. Educators can use this data to make adjustments to their teaching methods, curriculum, and interventions to enhance learning outcomes.
Privacy and Security
Given the sensitivity of educational data, KITABOO’s Learning Analytics Dashboards prioritize data privacy and security. They adhere to stringent security measures to protect student information and ensure compliance with data privacy regulations, such as FERPA in the United States.
Accessibility to All
To promote inclusivity in education, Learning Analytics Dashboards strive to be accessible to all users, including those with disabilities. This ensures that everyone, regardless of their abilities, can benefit from the insights and data-driven decisions these tools enable.
Also Read: White Label eBook Platform
Final Thoughts
Learning Analytics Dashboards are indispensable for eLearning platforms looking to provide effective, engaging, and data-driven educational experiences. By harnessing the power of data, these platforms can empower learners, support educators, and adapt to the changing needs of the digital learning landscape.
In an era where online education is more important than ever, Learning Analytics Dashboards are the bridge between potential and achievement in the world of eLearning.
Discover the future of education with the digital textbook platform – KITABOO’s transformative Learning Analytics Dashboard. Unleash the power of data to personalize learning experiences, track real-time progress, and make data-informed teaching decisions. Get started today for a brighter, data-driven tomorrow!
Contact our expert team now and get started!
To know more, please write to us at contact@kitaboo.com.
Suggested Reads:
Discover how a mobile-first training platform can help your organization.
KITABOO is a cloud-based platform to create, deliver & track mobile-first interactive training content.